Key Findings

Key Findings
The following provides a summary of the results and key findings from the project, broadly divided by research theme. References have been provided where appropriate, with further information available through the ‘Project outputs’ and ‘Academic papers’ sections of the website.
Evolution of landslide hazard
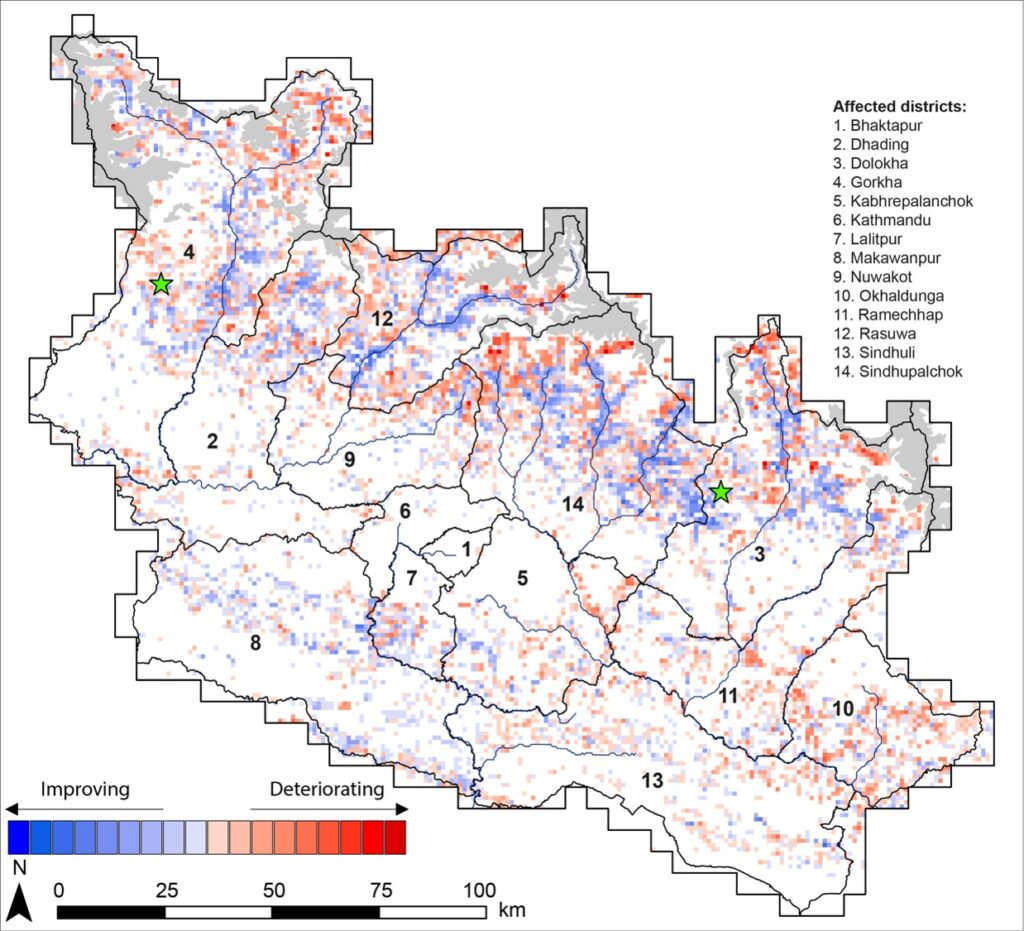
- Landslide hazard in the 14 worst-affected districts remains significantly higher in 2020 than on the day of the earthquake in 2015 (Rosser et al., 2021; Kincey et al., 2021).
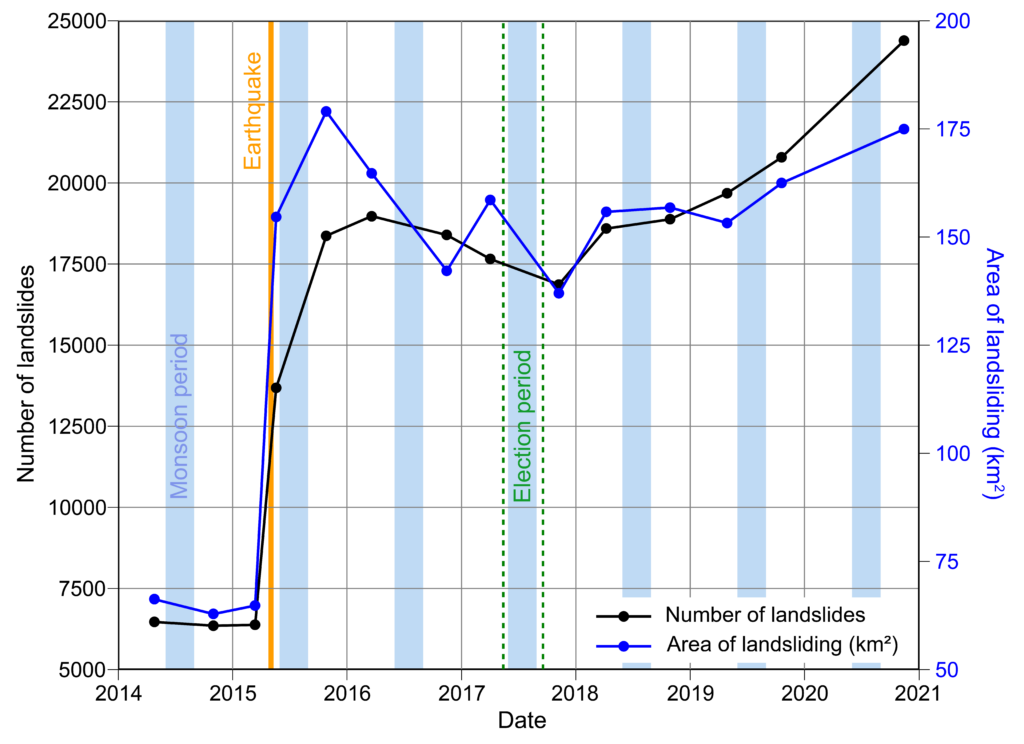
- The spatial pattern and density of landsliding has evolved through time, with systematic upslope and northward shifts (Kincey et al., 2021).
- Coseismic landslide locations tend to persist within mapped post-seismic inventories, but a wider population of newly activated, spatially dispersed landslides has also developed after the earthquake (Kincey et al., 2021).
Landslide risk reduction
- Landslide hazard, and therefore risk, evolves following a high magnitude earthquake, often rendering people’s previous understanding of their local risk context obsolete. This uncertainty is compounded further by local politics and attachment to place, demonstrating that there are affective dimensions to post-earthquake reconstruction that cannot be ignored (Oven et al., 2021).
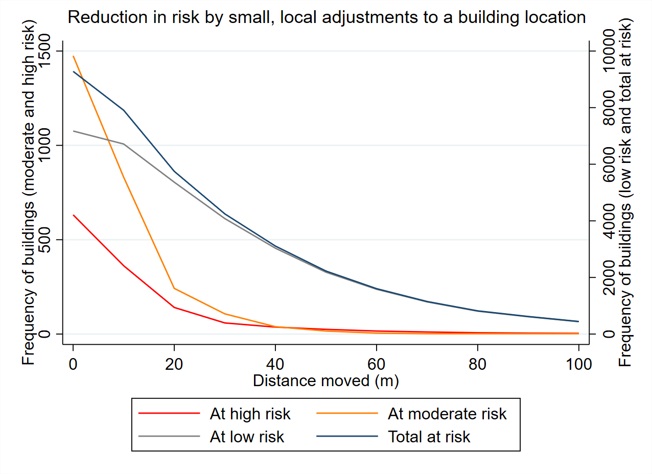
- The concentration of post-seismic risk moves systematically through the landscape, with a shift towards lower slope positions through time. However, this risk can be mitigated through small adjustments to where people live, with significant reductions in risk possible with movements of just ~20 m or less (Arrell et al., in prep).
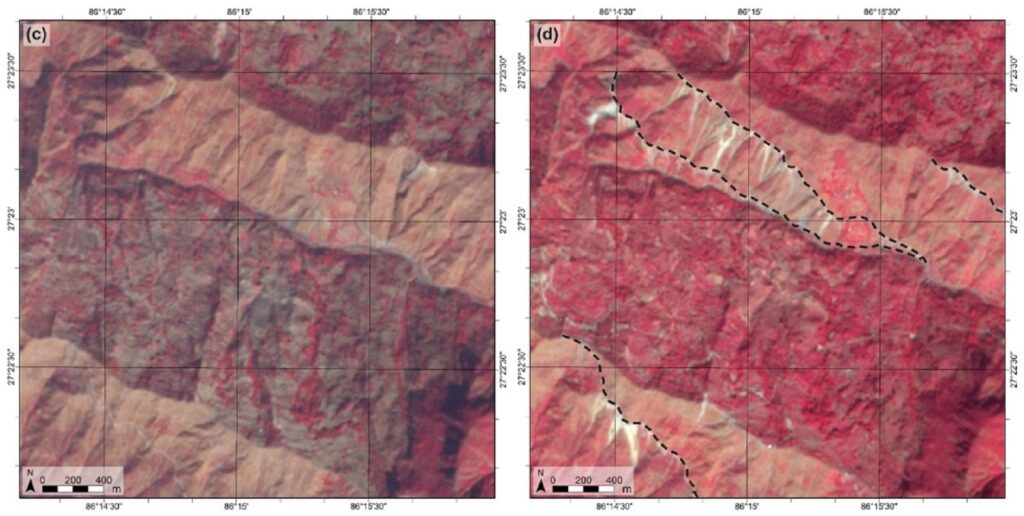
Landslide inventories and mapping techniques
- At present, many forms of landslide assessment are too slow to generate relative to the speed of a humanitarian response, despite increasingly rapid access to high-quality imagery (Williams et al., 2018).
- The value of information on landslides evolves rapidly as a disaster response develops, so identifying the purpose, timescales, and end users of a post-earthquake landslide assessment is essential to inform the approach taken (Williams et al., 2018).
- Automated approaches to generating landslide inventories are improving but manual mapping by trained analysts still remains the most accurate method. However, recent advances in cloud-based computing of time series satellite imagery holds considerable potential for future automated landslide mapping.
Landslide susceptibility modelling
- Current methods to identify coseismic landslides immediately after an earthquake using optical imagery are too slow to effectively inform emergency response activities. However, landslide susceptibility modelling provides the potential to model the distribution and relative intensity of coseismic landsliding within days of an earthquake (Robinson et al., 2017).
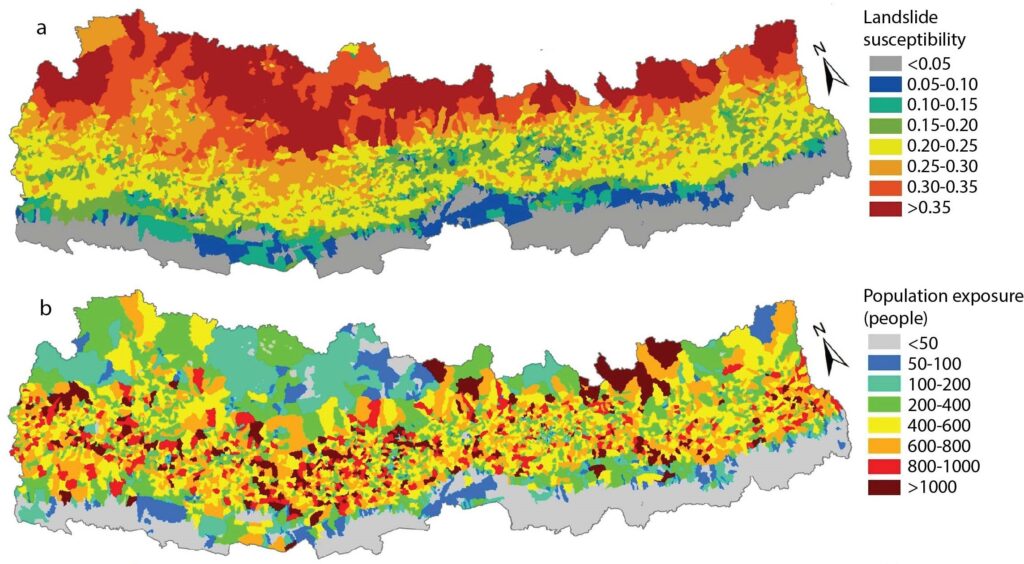
- Combining landslide susceptibility modelling with population and monetary asset value data allows relative landslide exposure to be determined, revealing considerable spatial variability in exposure rates across the densely-populated middle hills of Nepal (Swirad et al, in press).
Post-failure landslide runout hazard
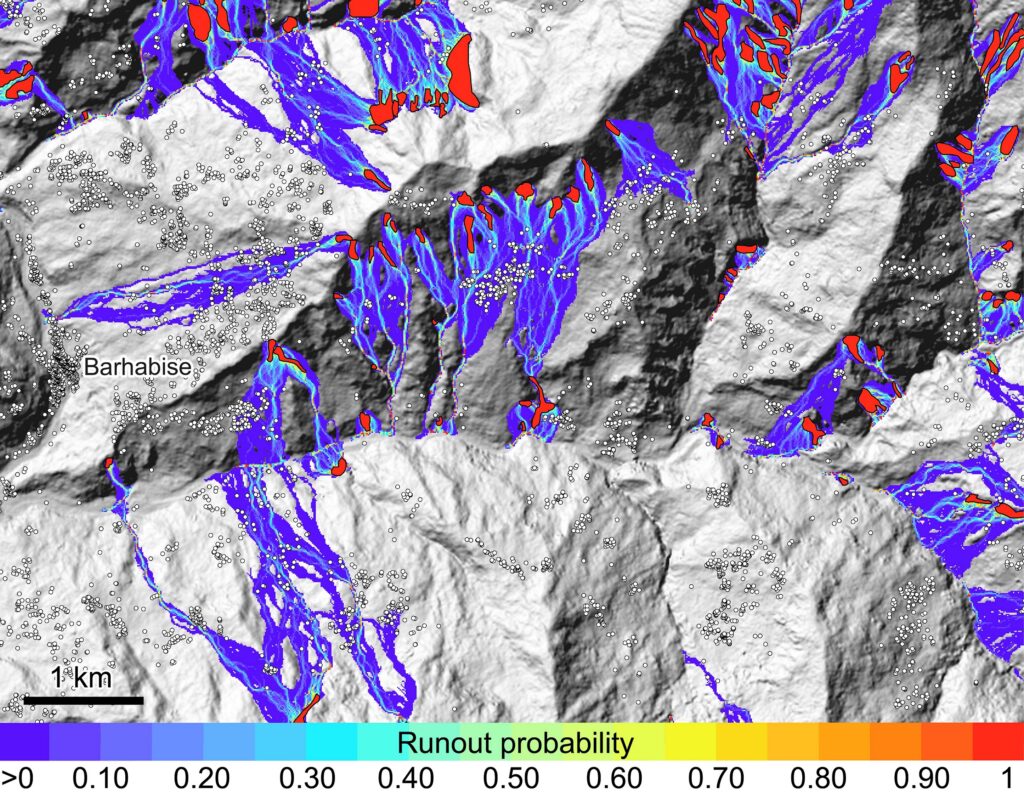
- The runout of existing landslide debris poses a long-term post-seismic legacy hazard in mountain regions, with significant implications for managing and reducing risk (Rosser et al., 2021).
- Although the precise timing of such post-seismic debris flows is difficult to predict, we can model the potential spatial extent across an entire earthquake-affected area. Understanding evolving spatial and temporal patterns of such cascading hazards is crucial for guiding decision-making associated with post-seismic recovery and reconstruction (Kincey et al., in prep).
Anthropogenic drivers of landsliding
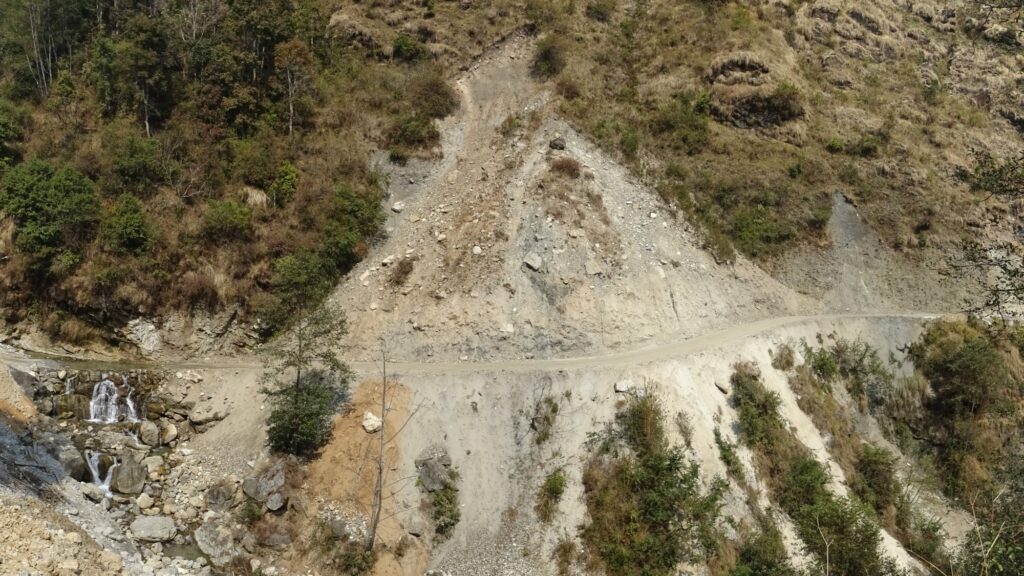
- Rural road construction across Nepal has increased dramatically since the 2015 earthquake, due to both governmental-level initiatives (e.g. Nepal’s sustainable development goals) and community-level factors, such as the local elections in 2017. Initial indications suggest that this proliferation of rural roads is leading to extensive landslide hazard-related issues (Rosser et al., 2021; Kincey et al., 2021).
- Demonstrating unequivocal links between road construction and landsliding across the entirety of Nepal is problematic due to the accuracy of available road network data and a lack of information on when individual road segments were initially constructed. However, testing of time series analysis within Google Earth Engine suggests that NDVI change detection techniques have the potential to both identify new roads and date the construction of pre-existing mapped road networks.