Landslide Maps

Landslide Maps
Here you will find links to an open online repository of maps for download covering all 135 individual palikas within the 14 districts most severely affected by the 2015 earthquakes. This includes maps in both Nepali and English, and each map includes an explanation of the data shown. All maps are suitable for printing at all sizes up to A0 and are in *.JPG format. The final link provides access to *.zip files to allow bulk download of maps organised by District. Note that individual map files are around 30 mb in size. We first provide a set of example maps for a single palika.
Example set of maps: Bhote Kosi gaunpalika, Sindhupalchok
The following provides quick access to a set of example maps for the Bhote Kosi gaunpalika in Sindhupalchok, to illustrate what is available for ALL palikas via the links below. We also include a brief guideline and interpretation of these example maps to inform local-level planning and decision making.
This includes:
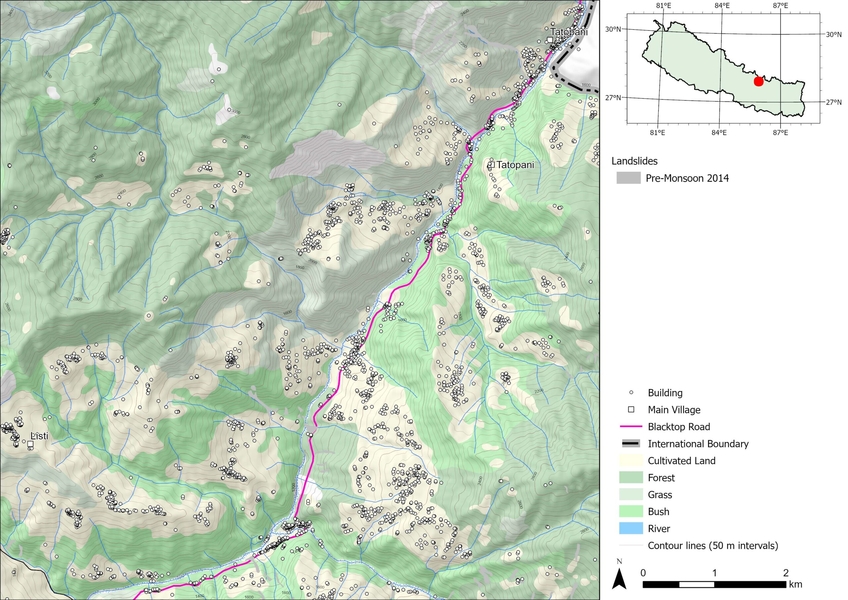
- Bhote Kosi gaunpalika example landslide hazard map
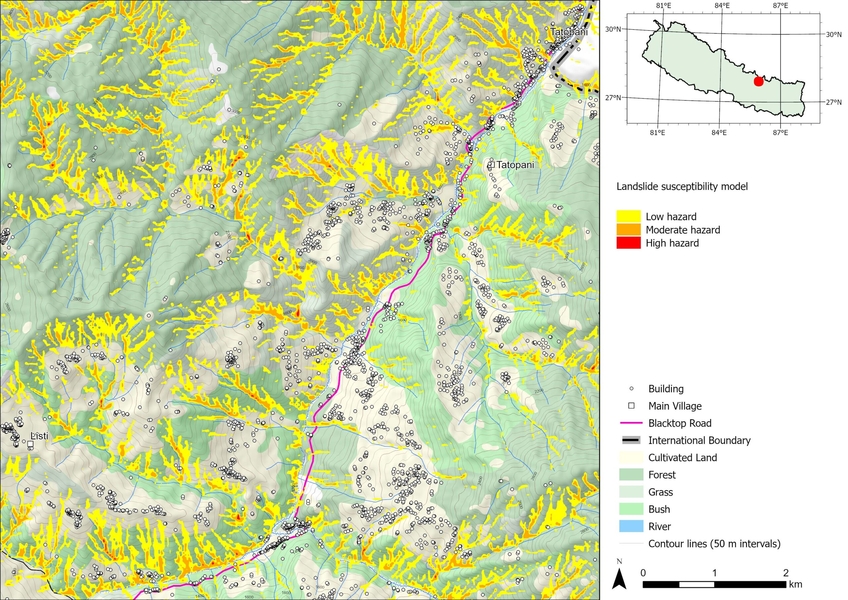
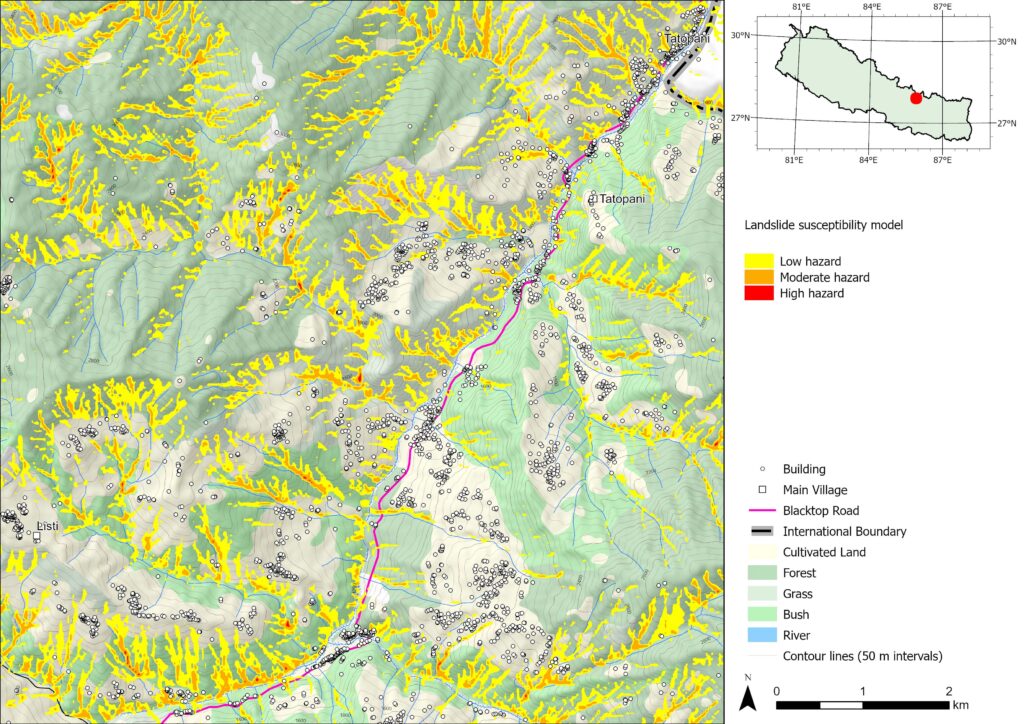
- Bhote Kosi gaunpalika example landslide susceptibility map
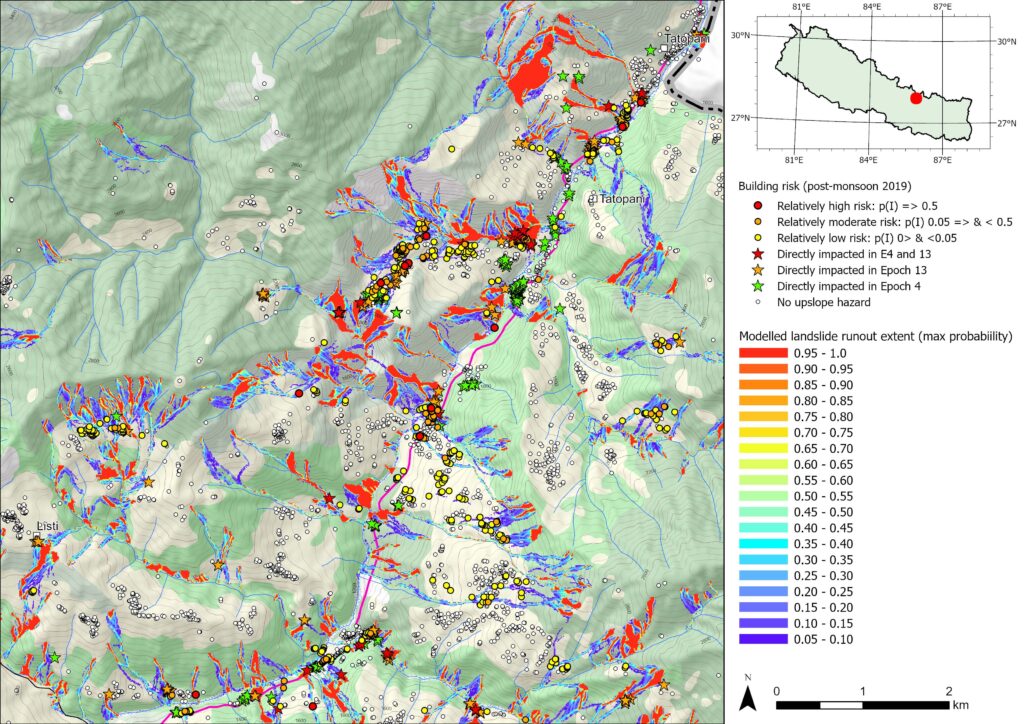
- Bhote Kosi gaunpalika example landslide runout risk map
Bhote kosi gaunpalika example guidelines and interpretation (Nepali)
Bhote kosi gaunpalika example guidelines and interpretation (English)
FULL LANDSLIDE MAP REPOSITORY:
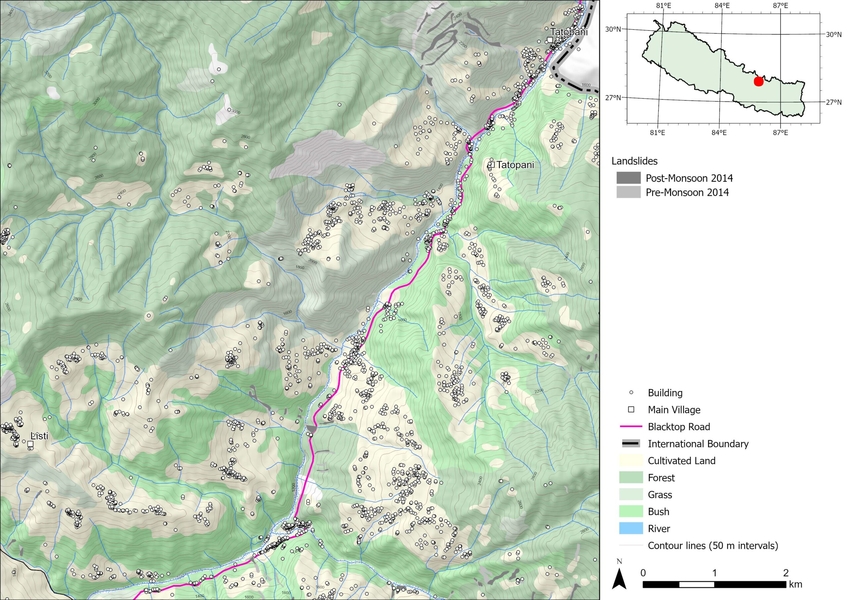
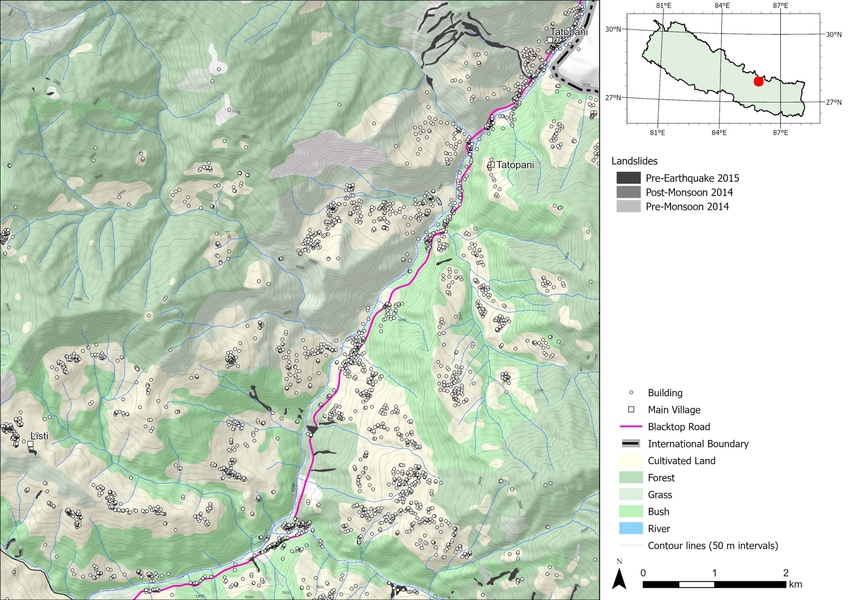
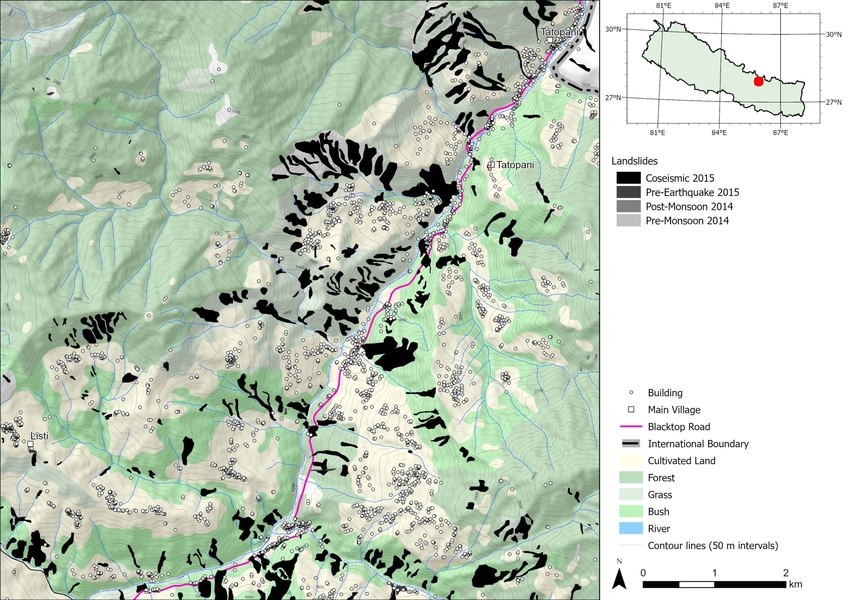
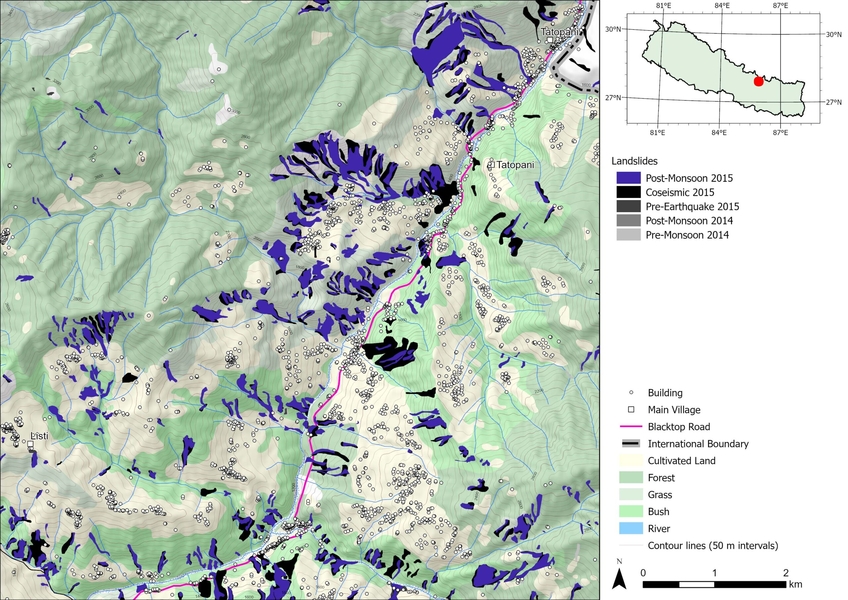
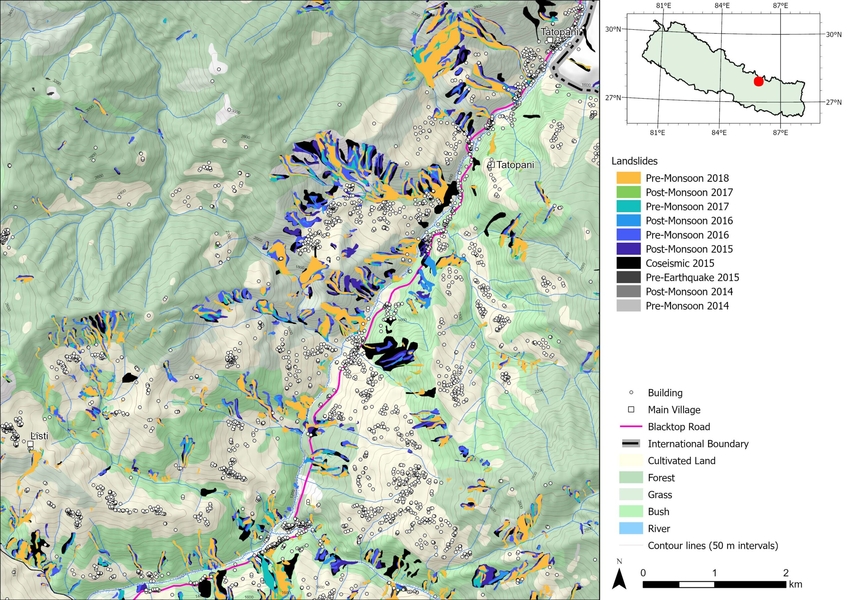
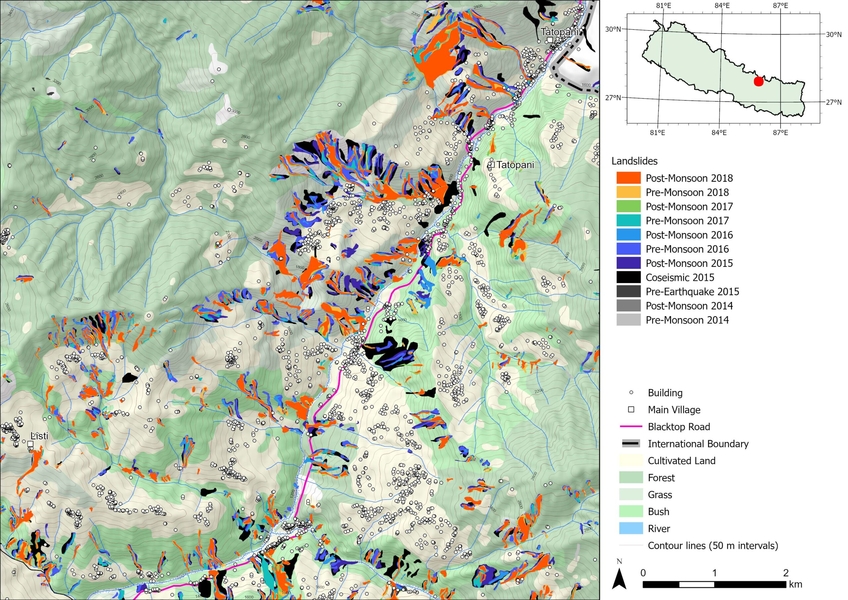
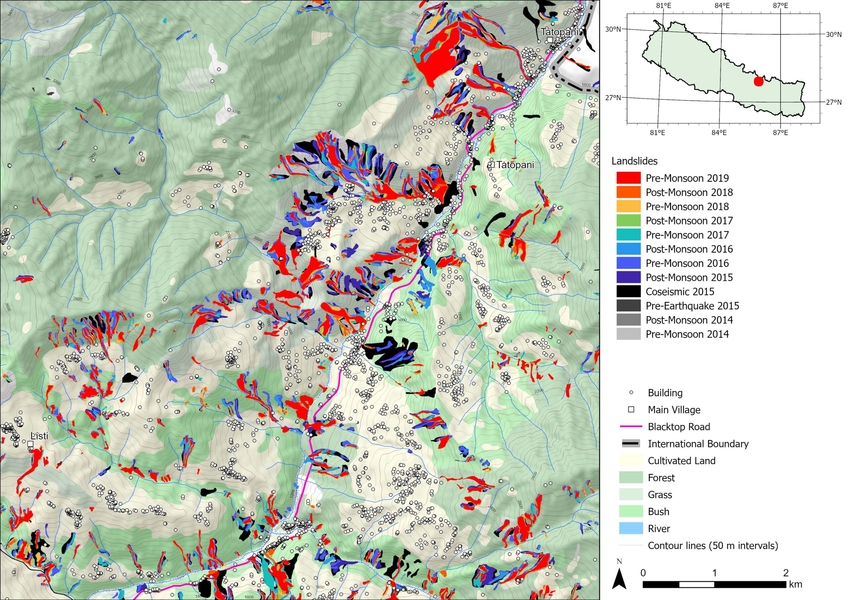
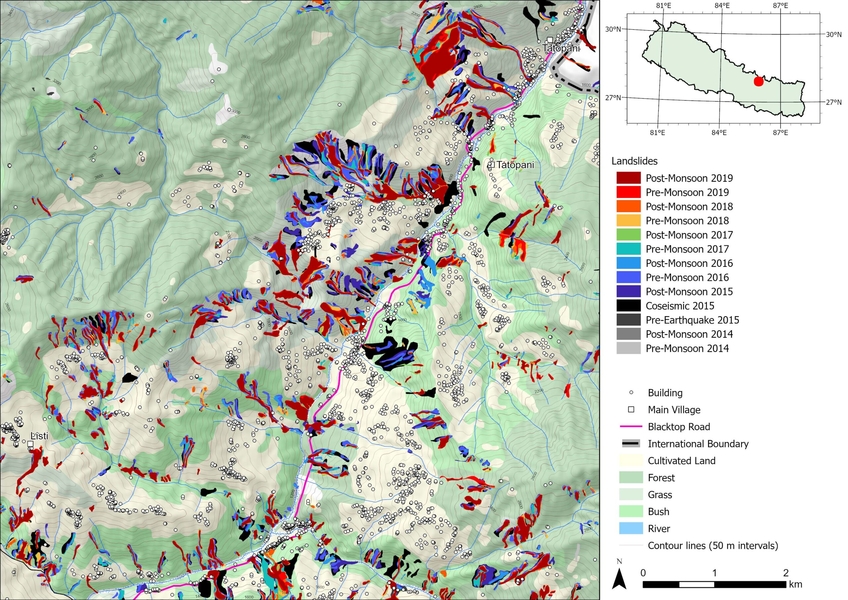
Palika-level maps of landslide hazard (2014 – 2020)
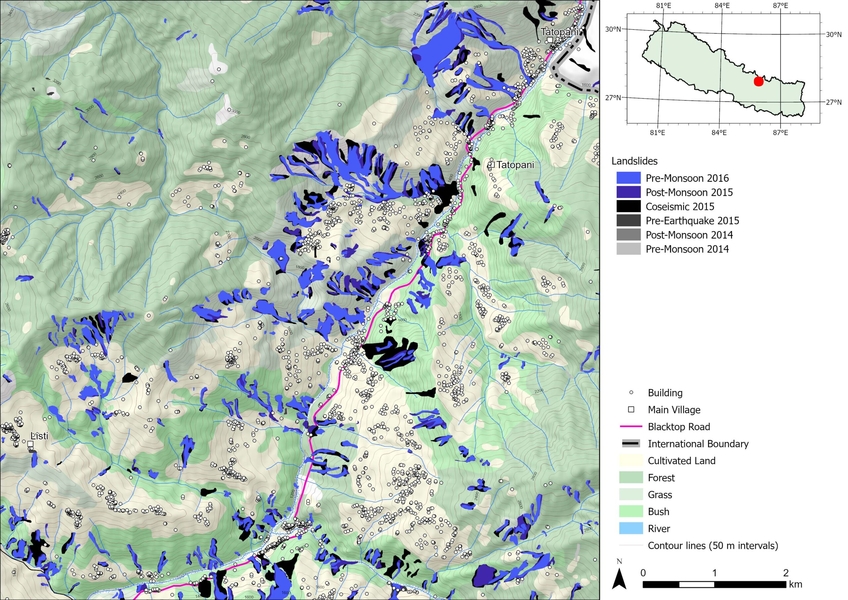
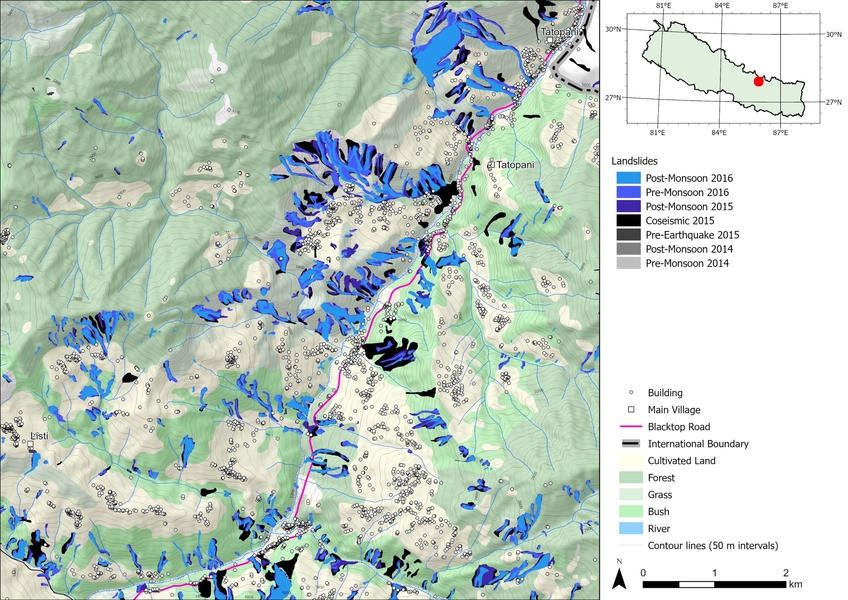
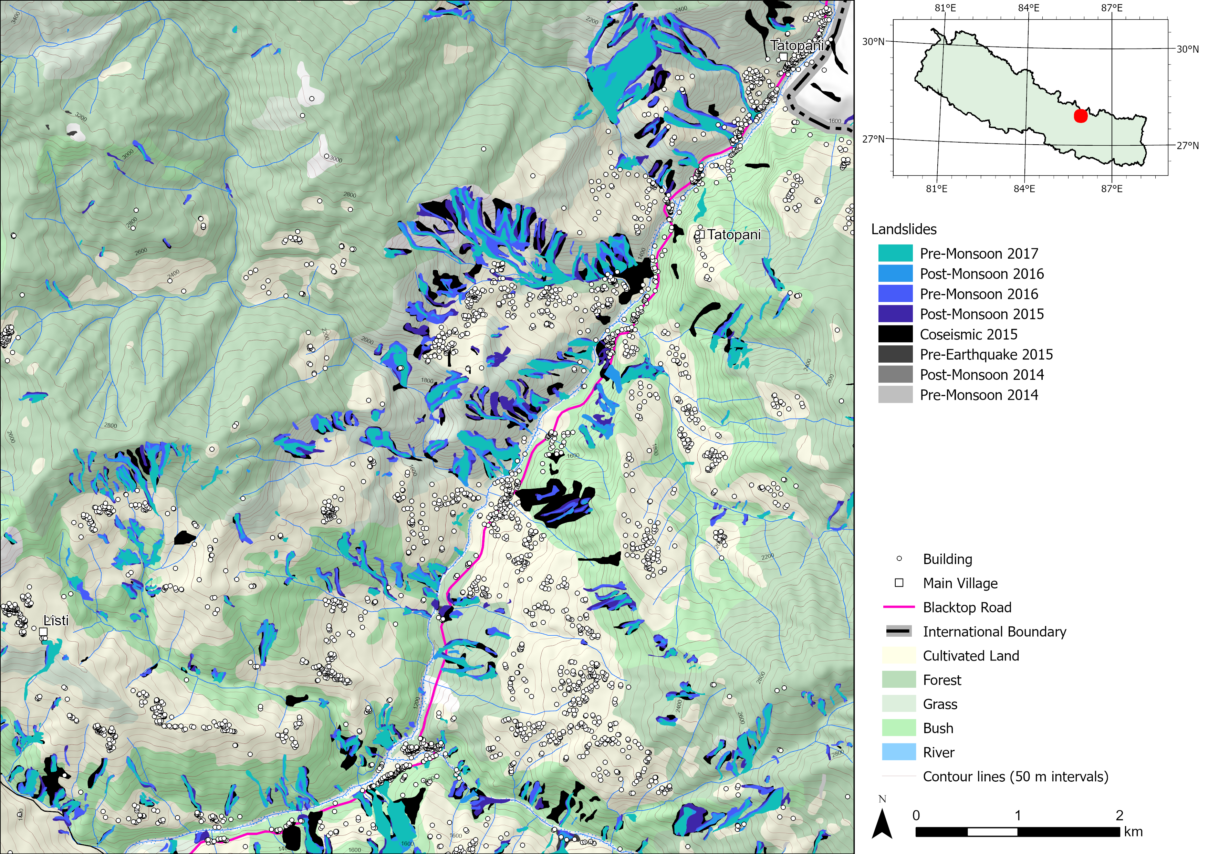
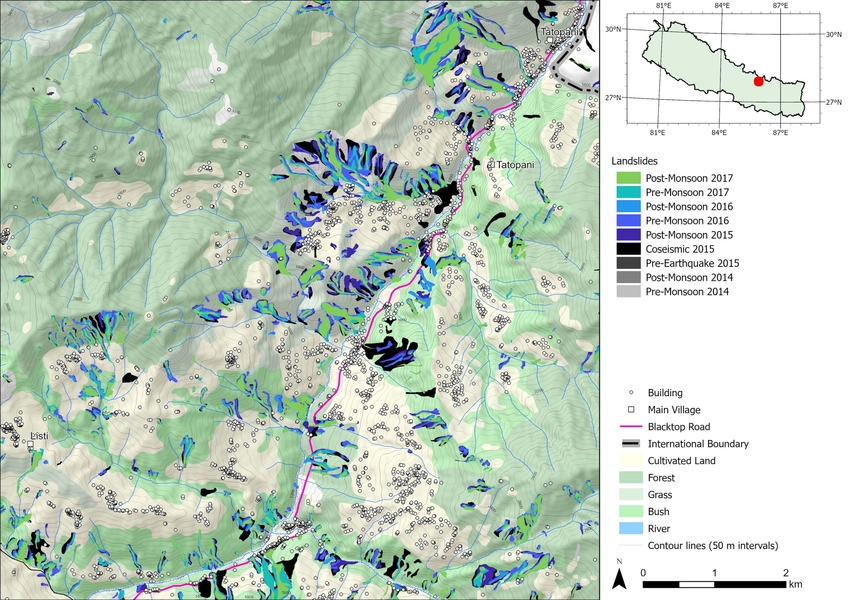
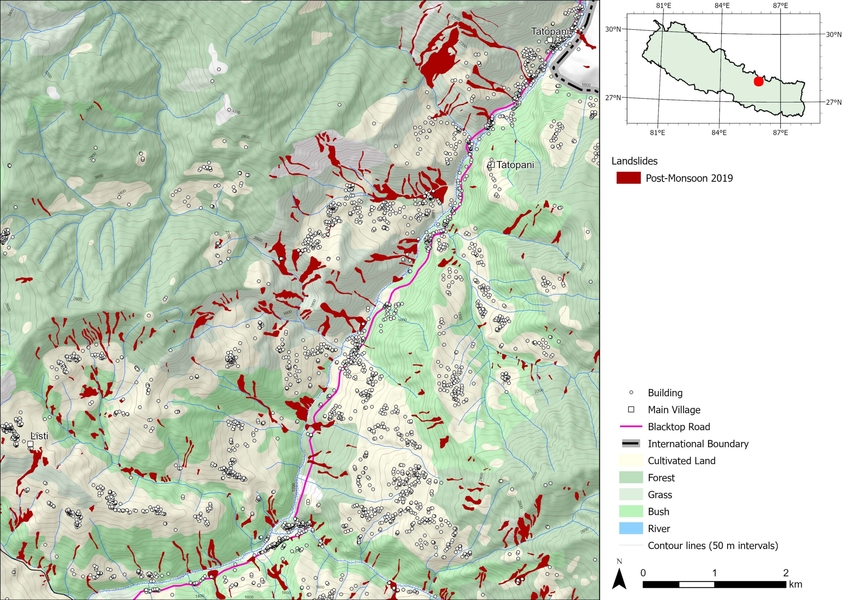
These maps show the locations of ALL landslides mapped since 2014 in ALL palikas. The mapping approach is described in Williams et al., (2018) and Kincey et al., (2021). The colour of the mapped landslide indicates the latest date at which it was mapped.

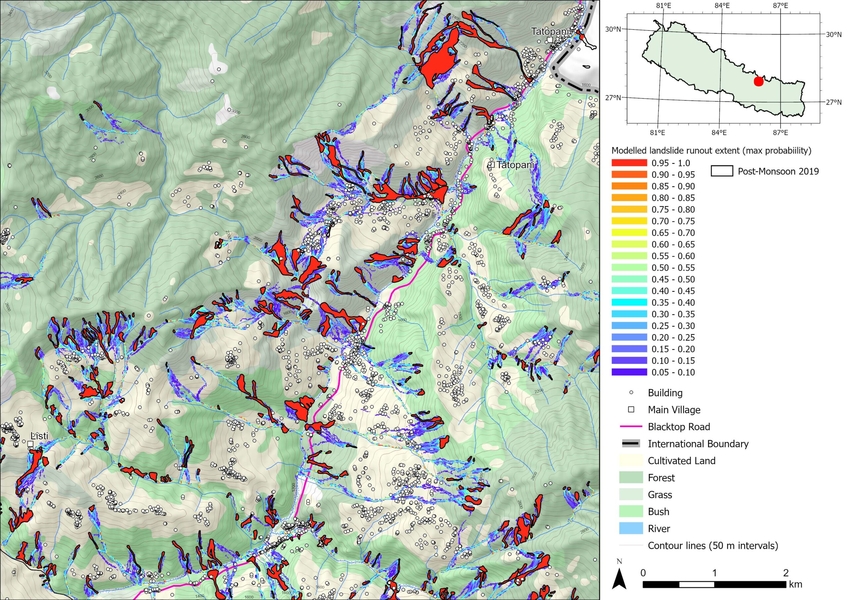
Palika-level maps of landslide susceptibility (2020)
These maps show landslide susceptibility for ALL palikas, generated using a model that predicts locations more likely to experience a future landslide. This is based on the model proposed by Kritikos et al., (2015). The model is trained on mapping of rainfall-triggered landslides only, and outputs at 30 m resolution. These maps are well suited to identifying both higher risk areas, and areas that are relatively safe during the next monsoon.
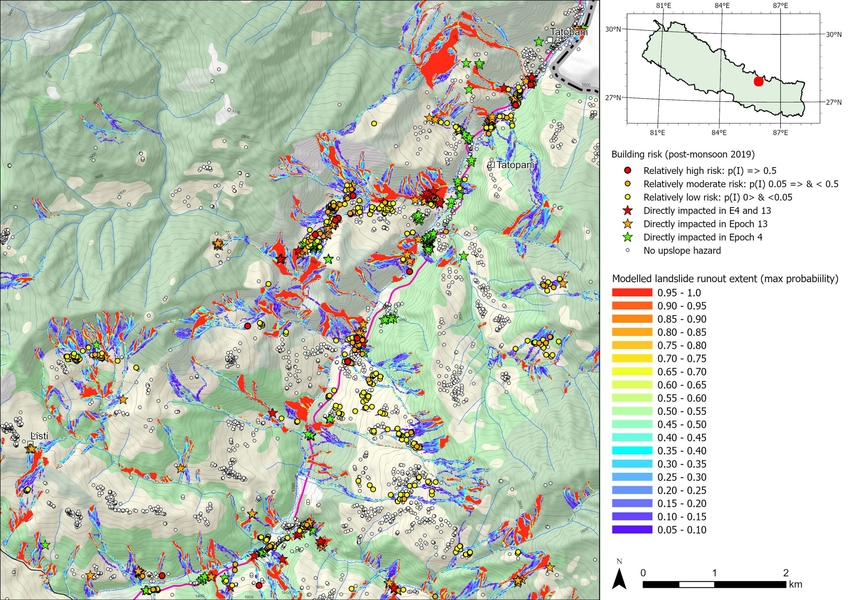
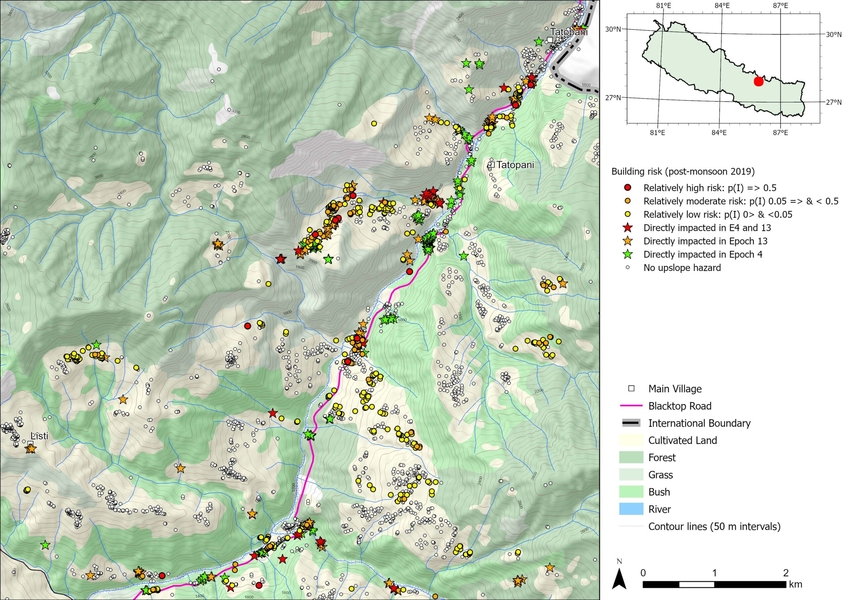
Palika-level maps of landslide risk model (2020)
These maps shows the relative risk to individual houses posed by landslides uphill in ALL palikas, based upon a landslide runout model. The model considers where landslides could flow under extreme rainfall conditions, and is based on the approach described in Horton et al., (2013). The relative risk to each house is indicated by a colour scale, from high to negligible. We provide a guidance note to accompany the interpretation of these maps. Please read the guidance note before downloading the maps.
Palika landslide risk map guidelines (Nepali)
Palika landslide risk map guidelines (English)
- Landslide runout & building risk maps, 2020 (Nepali, 10 m)
- Landslide runout & building risk maps, 2020 (English, 10 m)